#08 Probability (grades 6-10)
Regular price $20.95
Soft-bound, 64 page book, 28 reproducible task cards, full teaching notes.
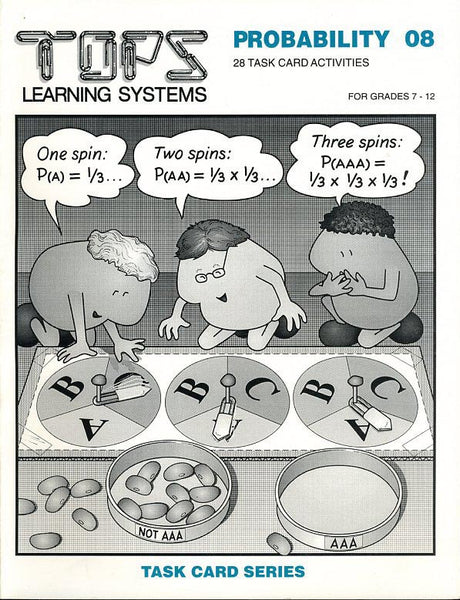
Involve your students in the mathematics of chance and the science of statistical analysis. Flip coins, spin an alphabet wheel, build a pinball machine based on Pascal’s Triangle, count permutations, tally combinations, plot frequency distributions, calculate odds on a paper-clip spinner, toss a pi without creating a mess!
More Information – click any of the tabs below to learn more about this title
Click here for a complete list of materials and convenient shopping.
1/15/15: towels, sweaters or other fabric to muffle sound (optional)7/105/150: pennies
1/15/15: hand calculators
* 1/8/8: rolls masking tape
* 1/15/15: bottle caps, unbent, all the same brand
1/15/15: empty cereal boxes, 32 ounce Grape-Nut boxes recommended
2/30/30: pieces corrugated cardboard, about 10x12 inches
1/4/8: heavy scissors (optional)
1/15/15: quarts package filler (paper "straw," styrofoam peanuts, or loosely wadded newspaper)
* 1/4/4: rolls clear tape
1/15/15: index cards, 4x6 inch
* 10/150/150: paper clips
1/10/15: size-D batteries, dead or alive
* 1/10/15: thick rubber bands
* 50/750/750: straight pins
1/5/15: metric rulers
* 1/15/15: plastic drinking straws
1/15/15: scissors
1/4/4: wire cutters
* 0.1/1/1: cups modeling clay
1/1/1: package pinto beans or equivalent
1/15/15: plastic sandwich bags or equivalent
4/60/60: jar lids or other shallow containers
2/10/30: dice
1/5/15: styrofoam cups
*10/50/150: flat thumb tacks, all the same brand
1/1/5: recycled phone book with white pages
* 1/1/1: roll black electrical tape
1/2/8: desk calculator with tape
10/150/150: flat wooden toothpicks
1/1/1: scientific calculator (trigonometry text with sine tables)
- Lesson 1: To toss a coin and record the outcomes as an up-and-down graph line. To appreciate that win-loss records that appear to favor one team or the other may really be a matter of chance.
- Lesson 2: To convert a running total of heads and tails into a cumulative ratio of outcomes. To appreciate that this ratio is predictable over the long run, even though individual outcomes are not.
- Lesson 3: To apply the techniques of probability analysis studied thus far to a biased "coin."
- Lesson 4: To develop the idea of permutations. To figure the probabilities of various permutations in multiple coin tosses.
- Lesson 5: To develop the idea of combinations. To throw 7 pennies at a time, and record a frequency distribution of combinations.
- Lesson 6: To compare an actual distribution of combinations for a penny toss with its ideal distribution.
- Lesson 7: To begin construction of a "pinball machine" based on Pascal's Triangle.
- Lesson 8: To complete construction of the pinball machine based on Pascal's Triangle. To plot a frequency distribution for 128 outcomes.
- Lesson 9: To calculate probabilities for a penny hitting pins on Pascal's triangle. To graph the most probable outcome distribution and compare it with previous results.
- Lesson 10: To compare right-left choices in Pascal's Triangle to other binomial probabilities.
- Lesson 11: To generate and evaluate additional bell curves on modified pinball machines.
- Lesson 12: To construct a set of 3 ABC spinners. To determine the probability of the paper clip spinner landing within each wedge.
- Lesson 13: To prepare a permutation tree and sample space for 3 spins of the ABC spinners.
- Lesson 14: To determine probabilities by counting different kinds of permutations in a sample space. To compare most probable outcomes with actual outcomes.
- Lesson 15: To construct a new set of numbered spinners and graph their most probable distribution on an Outcome Sheet.
- Lesson 16: To apply the mathematical ideas of "or" and "not" to a numbered spinner.
- Lesson 17: To apply the mathematical idea of "and" to numbered spinners and other systems of chance.
- Lesson 18: To write a sample space for rolling a pair of dice. To work out probabilities for rolling various permutations.
- Lesson 19: To develop a probability distribution for 10 randomly tossed tacks landing upright. To express the central tendency as a mode, median and mean.
- Lesson 20: To construct an alphabet spinner. To distinguish between the high probability of a class of events happening and the low probability of a specific event happening within that class.
- Lesson 21: To construct a random string of binomial outcomes based on phone numbers.
- Lesson 22: To appreciate that runs and patterns are a common occurrence in the fabric of randomness.
- Lesson 23: To examine lead changes between evenly matched binomial outcomes.
- Lesson 24: To graph the frequencies of run lengths on the tooth tape. To compare them with run probabilities on Pascal's triangle.
- Lesson 25: To compare an actual frequency distribution of runs to its ideal distribution as predicted by the "and" rule. To estimate run frequencies in a phone book.
- Lesson 26: To estimate the probability of a randomly tossed penny landing on a grid line. To confirm this probability with simple geometric analysis.
- Lesson 27: To estimate the probability of a randomly tossed toothpick landing on a grid line. To confirm that this probability approaches 2 divided by pi.
- Lesson 28: To estimate the probability of a toothpick hitting a grid line by averaging the sines of the angles it makes with the grid. To approach a limiting value of 2 divided by pi.
We encourage improvisation - it's one of the main goals of our hands-on approach! You and your students might invent a simpler, sturdier or more accurate system; might ask a better question; might design a better extension. Hooray for ingenuity! When this occurs, we'd love to hear about it and share it with other educators.
National Science Education Standards (NRC 1996)
Teachers of science...
A: ...plan an inquiry-based science program. (p. 30)
B: ...guide and facilitate learning. (p. 32)
C: ...engage in ongoing assessment of their teaching and of student learning. (p. 37)
D: ...design and manage learning environments that provide students with the time, space, and resources needed for learning science. (p. 43)
• Represent a central event or phenomenon in the natural world.
• Represent a central scientific idea and organizing principle.
• Have rich explanatory power.
• Guide fruitful investigations.
• Apply to situations and contexts common to everyday experiences.
• Can be linked to meaningful learning experiences.
• Are developmentally appropriate for students at the grade level specified.
Core Concepts/Processes: Sample spaces predict ideal frequency distributions, but only after many rolls of the dice.
Core Inquiries: Count permutations • tally combinations • plot frequency distributions • calculate probabilities. • Decide whether a tack landing "heads" or "tails" is fair or biased.
Core Content: A gambler claims that a pair of dice are "hot" or "cold." If the dice are fair, can this be true?
Core Content: Develop a frequency distribution based on Pascal's triangle.
TEACHING Standards
These 28 task cards promote excellence in science teaching by these NSES criteria:Teachers of science...
A: ...plan an inquiry-based science program. (p. 30)
B: ...guide and facilitate learning. (p. 32)
C: ...engage in ongoing assessment of their teaching and of student learning. (p. 37)
D: ...design and manage learning environments that provide students with the time, space, and resources needed for learning science. (p. 43)
CONTENT Standards
These 28 task cards contain fundamental content as defined by these NSES guidelines (p. 109).• Represent a central event or phenomenon in the natural world.
• Represent a central scientific idea and organizing principle.
• Have rich explanatory power.
• Guide fruitful investigations.
• Apply to situations and contexts common to everyday experiences.
• Can be linked to meaningful learning experiences.
• Are developmentally appropriate for students at the grade level specified.
Unifying Concepts and Processes
NSES Framework: Systems, order, and organization • Evidence, models and explanation • Constancy, change, and measurementCore Concepts/Processes: Sample spaces predict ideal frequency distributions, but only after many rolls of the dice.
Science as Inquiry (content standard A)
NSES Framework: Identify questions that can be answered through scientific investigations. • Design and conduct a scientific investigation. • Use appropriate tools and techniques to gather, analyze, and interpret data. • Develop descriptions, explanations, predictions, and models using evidence. • Think critically and logically to connect evidence and explanations. • Recognize and analyze alternative explanations and predictions. • Communicate scientific procedures and explanations. • Use mathematics in all aspects of scientific inquiry.Core Inquiries: Count permutations • tally combinations • plot frequency distributions • calculate probabilities. • Decide whether a tack landing "heads" or "tails" is fair or biased.
Science in Personal and Social Perspectives (content standard F)
NSES Framework: Risks and benefits • Personal and community healthCore Content: A gambler claims that a pair of dice are "hot" or "cold." If the dice are fair, can this be true?
History and Nature of Science (content standard G)
NSES Framework: Science as a human endeavor • History of scienceCore Content: Develop a frequency distribution based on Pascal's triangle.

